Khoury News
Khoury researchers highlight data accuracy, clarity, and usability at IEEE VIS 2026
As the world's most renowned visualization conference visits Boston in November, Khoury researchers — be they local residents or faraway faculty — are flocking to showcase their findings.
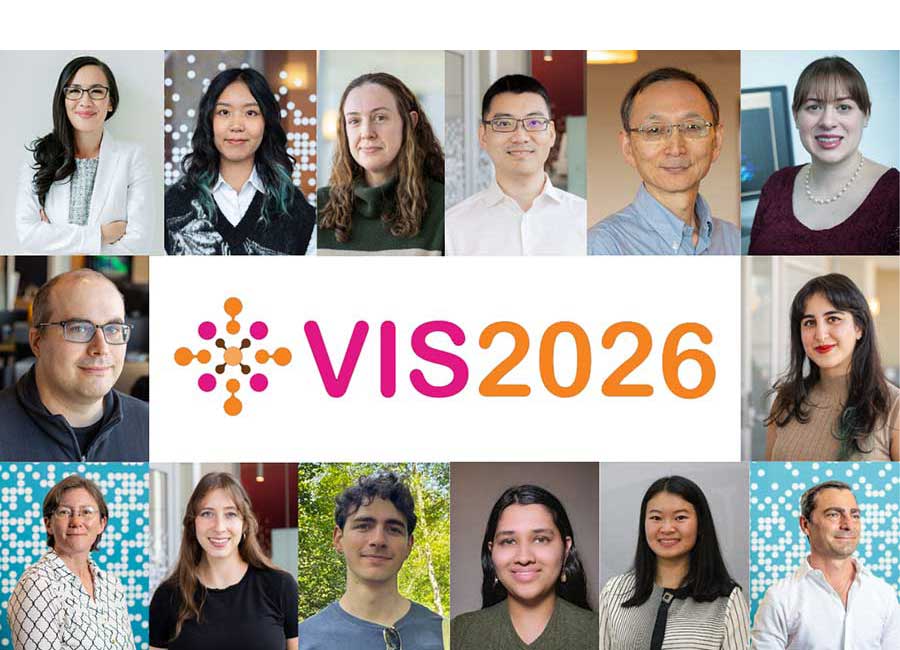
Khoury researchers are due to make a strong showing at the upcoming IEEE Visualization and Visual Analytics Conference (IEEE VIS), with 19 faculty, staff, and students contributing eight papers, three posters, and a handful of workshops, panels, and other presentations. One of these works, “Visualizing High-Dimensional Graph Embeddings via Informed Multi-View Projections,” received an honorable mention award. Additionally, Assistant Professor Lace Padilla serves as one of the general chairs of the conference, and Khoury Professor of the Practice Melanie Tory serves as one of the overall paper chairs.
READ: Lace Padilla wins award for studying uncertainty in data visualization
To discover the college’s research at IEEE VIS 2026 — ordered by presentation date and time (ET) — jump to any of the linked summaries below or simply read on.
Monday, November 9
Wednesday, November 11
Beyond Time and Errors: Novel Evaluation Methods for Visualization (panel)
Learning what’s true, doing what’s right
November 9, 8–4 p.m.
Khoury participants: Michael Correll, Mahsan Nourani
The BELIV (Evaluation and Beyond: methodoLogIcal approaches for Visualization) workshop celebrates its 20th year at IEEE VIS in 2026, bringing together researchers interested in how visualization can be evaluated and understood.
This year’s full-day workshop, with its focus on “Learning what’s true, doing what’s right,” will explore questions around evaluating visualization, understanding how people interpret visual information, and developing better approaches to assessing visualization systems and their effects.
Assistant Research Professor Mahsan Nourani and Associate Research Professor Michael Correll are the Khoury members of the panel. They will aim to use the workshop to bridge the gap between visualization researchers and practitioners through paper presentations, breakout sessions, and a keynote talk.
Capturing No-tech AI Mental Models from Craft Supplies: An AI Literacy Workshop
Making AI with crafts
November 9, 8–11:30 a.m.
Khoury participants: Shani Spivak, Shira Michel, Mahsan Nourani
As generative AI becomes increasingly common in education, it can be difficult to teach people how it works and how they can better understand it, especially in technically heavy discussions.
Khoury researchers have developed a hands-on AI literacy workshop that uses craft materials to help participants express and examine their mental models of AI. Their EduVis presentation, part of EduVis 2026’s broader focus on new approaches to education, inclusion, and visualization literacy, explores how low-tech, physical activities can make abstract ideas about AI easier to discuss and reflect on.
Vis x Vision Workshop
Where visualization meets vision
November 9, 10:20–11:30 a.m.
Khoury participants: Michael Correll
As visualization and computer vision increasingly overlap, researchers are exploring how techniques from each field can inform the other. In this vein, Michael Correll will join several other researchers for a panel discussion at the VIS x Vision Workshop.
The panel will bring together researchers working across visualization, computer vision, and visual analysis to discuss connections between the fields and emerging opportunities for research. Correll will highlight Khoury College’s work at the intersection of visualization and human-centered computing, as well as the ways in which people interpret and interact with visual information.
Visualizing Uncertainty in Non-linear Projections with Ensembles (short paper workshop)
How reliable are your data visualizations?
November 9, 1–4:30 p.m.
Khoury participants: Kai Nylund, Michael Correll, Lace Padilla
Dimensionality-reducing techniques such as UMAP and t-SNE are becoming common tools for exploring complex datasets, but their results can be difficult to interpret because different runs can produce noticeably different visualizations. Khoury researchers have investigated how visualization can better communicate this uncertainty.
The team proposes using ensembles of multiple projects rather than relying on a single result. They visualize the median projection across runs and introduce small perturbations to the input data to distinguish meaningful structure from patterns caused by overfitting. Their experiments show that median projections perform comparably to individual runs, while perturbing the data can emphasize broader, global patterns over local details. They also demonstrate how relatively simple ensemble visualizations can help researchers see and communicate the reliability of patterns in dimensionality-reduction visualizations.
Visualizing in the Mind’s Eye: Icon Design Shapes Mental Imagery of Fire Risks (short paper)
How fire icons shape our imagination
November 10, 10–11:30 a.m.
Khoury participants: Wen Xu, Anjana Arunkumar, Lace Padilla
As data visualizations increasingly inform decisions about public safety, the way information is depicted can influence not only what people understand, but also what they imagine and how they respond emotionally.
In a study of 400 participants, researchers explored how the design of fire risk icons shape people’s mental imagery and risk-related decisions, finding that abstract, geometric icons prompted more vivid, varied, and personalized mental imagery than concrete icons depicting houses on fire. This increased mental imagery was associated with more risk-averse decisions, in part by evoking negative emotions.
The findings challenge the assumption that more literal, concrete visualizations are always more effective. They also highlight how visualization design can shape the psychological and emotional processes behind decision-making, with implications for communicating fire risks and other public safety information.
Charting the Moral Universe: Capturing Virtues and Values of Data Visualization Practice (paper)
The values behind data visualization
November 10, 1–2 p.m.
Khoury participants: Enrico Bertini, Michael Correll
Data visualizations shape how people understand information, make decisions, and see the world, but the ethics of visualization design involves so much more than simply presenting data accurately.
Through interviews with experienced visualization practitioners, researchers explored the values and moral responsibilities that guide data visualization researchers, designers, and artists, identifying 68 values organized into nine clusters. In offering a broader vocabulary for thinking about ethical visualization practice, the work helps researchers, educators and designers reflect on whether a visualization is accurate, what values it communicates, whose interests it serves, and what responsibility its creators hold.
Beyond the Post Hoc User Study: Modeling Visual Decision-Making with Active Inference (paper)
How people think through charts
November 10, 3–4:30 p.m.
Khoury participants: Lace Padilla
Evaluations of data visualizations often rely on user studies conducted after a design is complete, making it difficult to predict why people misinterpret charts or how design choices might affect their decisions.
The team used active inference — a framework for modeling how people perceive information, update their beliefs, and choose where to focus their attention — to understand how people interpret visual information. In a proof-of-concept simulation of bar-chart interpretation, they modeled two types of decisionmakers: fast, intuitive thinkers who are more susceptible to bias from prominent axis markings, and slower, analytical thinkers who are more vulnerable to information fading from working memory.
By making these cognitive processes visible and adjustable, the research offers a way to test hypotheses about visualization errors before relying solely on post-design user studies. The approach could help researchers better predict when visualizations may mislead or confuse audiences and develop more effective designs.
Should We Dangle a Carrot? The Effect of Performance-based Incentives in Visualization Experiments (paper)
Does money motivate? Incentives in visualization studies
November 10, 3–4:30 p.m.
Khoury participants: Michael Correll
Researchers often use controlled experiments to compare how well different data visualizations help people understand information, and some offer cash rewards for answering correctly. This research team wanted to know whether these incentives actually improve participants’ performances.
The team conducted two crowdsourced experiments: one testing how people perceive correlations in scatterplots and parallel coordinate plots, and another examining how people make decisions using weather forecasts displayed as interval or density plots. Across both studies, financial incentives had no measurable effect on task performance.
These findings challenge the assumption that monetary rewards necessarily motivate participants to perform better in visualization experiments. Although the results require replication, they highlight the importance of carefully evaluating experimental design choices to ensure that visualization studies produce reliable, meaningful conclusions.
Facts & All the Feels: Data Visualization Through the Affective Lens (panel)
Beyond the facts: How data visualization makes us feel
November 10, 3–4:30 p.m.
Khoury participants: Wen Xu
Data visualizations are often treated as objective representations of facts, but design choices can shape not only what audiences understand, but also what they feel and how they respond. In high-stakes public communication around climate change, public health, and civic issues, visualizations may intentionally evoke emotions to capture attention, influence attitudes, or encourage action. The challenge is balancing emotional engagement with accurate communication, particularly when audiences bring different experiences, values, and levels of trust to the information they encounter.
The panel “Facts & All the Feels: Data Visualization Through the Affective Lens” will bring the visualization community together to examine the role of emotion in visual communication. The discussion will explore how effective responses influence the interpretation of data, how emotional techniques can be evaluated, and how ethical responsibilities extend across the visualization process — from collecting and processing data to designing graphics and sharing them through media platforms.
The panel aims to move the conversation beyond simply avoiding misleading charts toward a broader understanding of responsible engagement. By asking when designing for emotion is appropriate, how its effects should be measured, and what responsibilities designers and media platforms hold, the discussion seeks to help researchers and practitioners communicate compellingly without undermining trust or manipulating audiences.
“Trust Junk” Leads to Unjustified Support for Highly Discriminatory Predictive Models (short paper)
Trusting the wrong AI
November 11, 8–9:30 a.m.
Khoury researchers: Michael Correll, Mahsan Nourani
Visual explanations are often used to help users understand and evaluate how AI models work. But explanations can also make people trust AI systems more than the AI deserves.
Through a crowdsourced study, the team found that providing accurate but irrelevant or unnecessary information in a model’s explanations could increase participants’ trust and positive perceptions of the model, even when the model was clearly discriminatory. The researchers describe this phenomenon as “trust junk”: information that may be factually correct, but that lends an AI system undeserved credibility without meaningfully demonstrating its reliability or fairness.
The findings highlight the risks of using data visualizations to explain AI decisions without considering their persuasive effects. The research calls on visualization designers and AI developers to look beyond whether explanations are technically accurate and consider whether they encourage users to trust systems that may be harmful or unjust.
Visualizing High-Dimensional Graph Embeddings via Informed Multi-View Projections (short paper, honorable mention winner)
Beyond 2D: Finding the best views of complex networks
November 11, 8–9:30 a.m.
Khoury researchers: Ya Ji, Xuefeng Li, Peng Zhang, Yifan Hu
Graphs are often visualized in two dimensions, but flattening complex networks into a single view can distort relationships and hide important structural patterns. Khoury researchers, alongside collaborators from the Technical University of Munich, developed a new approach to make high-dimensional graph structures easier to explore.
The team’s method embeds graphs in a higher-dimensional space and identifies informative two-dimensional viewpoints that improve readability, including reducing edge crossings and the clarity of connections. They also introduced DataFly, an interactive visualization system that lets users navigate smoothly between different candidate views of a graph.
In numerical experiments, the selected viewpoints outperformed conventional graph layouts on readability measures, and a usability study showed that the approach could reveal structural patterns hidden in traditional visualizations. The work demonstrates how combining high-dimensional representations with interactive exploration can help researchers better understand complex networks.
Beyond Initial Creation: Two Decades of Community-based Chart Revisions from Wikimedia Commons (short paper)
How communities reshape visualizations over time
November 11, 10–11:30 a.m.
Khoury researchers: Melanie Tory
Charts shared on platforms like Wikipedia are rarely static; over time, community members revise their appearance, update labels, and change the data they present. Yet little is known about how people collectively modify visualizations or how these changes evolve.
Khoury researchers have studied two decades of chart revisions on Wikimedia Commons to better understand how visualizations change through community contributions. They curated a massive dataset containing more than 7,000 revisions across nearly 2,000 chart images, then used large language models to categorize different types of edits.
They found that charts revised by many contributors tended to have more changes in styling and text than those edited by a single person. They also found that visual styling and text changes — as compared against edits to underlying data — occur in more concentrated bursts over time. While editable Scalable Vector Graphics (SVG) charts attracted more contributors and revisions than raster images, their changes tended to be more narrowly focused and less varied.
Parts Measured, Persons Missed: A Profile-Centered Account of Visualization User Experience (short paper)
What kind of vis viewer are you?
November 11, 10–11:30 a.m.
Khoury researchers: Anjana Arunkumar, Lace Padilla
Data visualization research often examines individual traits — such as graph literacy, spatial ability, and critical thinking — to understand why some people interpret charts differently from others. But these traits alone often fail to explain how people experience and respond to visual information.
Using responses from more than 300 participants who viewed 100 real-world visualizations, the researchers applied latent profile analysis to examine how perception, attention, and memory work together. They identified four distinct profile viewers: the Analytical Engager, Aesthetic Appreciator, Affective Integrator, and Detached Processor. These profiles predicted visualization interpretation better than individual traits considered separately.
The findings suggest that understanding how people engage with visualizations requires looking beyond isolated abilities to consider the different ways viewers perceive, attend to, and remember information. This approach could help researchers evaluate visualizations more effectively and support the development of tools that adapt to different audience needs.
Cognitive Affordance in Visualization: Related Constructs, Design Factors, and Framework (paper)
Designing for the mind
November 11, 1–2:30 p.m.
Khoury researchers: Racquel Fygenson, Lace Padilla, Enrico Bertini
Visualizations do more than display data; their design can influence what readers notice, how they interpret information, and which conclusions they draw. While researchers have studied these effects through concepts such as attention, perception, and mental models, visualization research lacks a unified framework for understanding how design choices enable or encourage particular cognitive processes.
The team worked to address this gap by bringing cognitive affordance theory — the study of how design influences the mental actions available to a person — into the context of data visualization. By synthesizing work from psychology, human–computer interaction, and visualization, they developed a framework connecting visualization design decisions and reader characteristics to the hierarchy of information a chart communicates. The framework helps explain why the same visualization may guide different readers toward different observations or interpretations. The authors also demonstrate how it can be used to evaluate existing visualizations and guide their redesign.
Mixed Uncertainty in One View: Co-Visualizing Statistical Variability and Qualitative Confidence (paper)
Visualizing uncertainty and expert confidence together
November 12, 8–9:30 a.m.
Khoury researchers: Racquel Fygenson, Lace Padilla
Forecasts often communicate uncertainty through confidence intervals, but statistical variability is only part of the picture. Experts may also have qualitative confidence in a prediction based on their judgement of the situation and its context.
Across three studies involving 923 participants, the team tested ways to display qualitative confidence alongside confidence intervals in line-chart forecasts. They explored separate text and icon indicators, as well as visual encodings that integrate confidence into the chart using color, transparency, and blurred lines. The researchers found that communicating qualitative confidence can change how people make decisions, and that several non-textual visual techniques can produce similar effects.
The findings offer practical guidance for designing forecasts that communicate not just the statistical range of possible outcomes but also experts’ confidence in their predictions. By making these distinct forms of uncertainty easier to interpret together, the research could help people make more informed decisions when evaluating uncertain forecasts.
Seeing Through the Forecast Clutter: Communicating Climate Forecast Distributions with Weighted Multiple Forecast Visualizations (paper)
Forecasting without the fog
November 12, 8–9:30 a.m.
Khoury researchers: Racquel Fygenson, Dakuo Wang, Michael Correll, Lace Padilla
Climate forecasts often differ because models make different assumptions about how the climate system will evolve. To understand uncertainty, readers need to see not only the overall range of predictions, but also how individual forecasts are distributed. Traditional confidence interval plots summarize that range, but can hide important differences between forecasts and even lead readers to assume the predictions follow a normal distribution when they do not.
Across two experiments involving 1,380 participants, the researchers compared confidence interval plots with multiple forecast visualizations (MFVs), which display individual forecasts rather than only a summary of their spread. In the first experiment, involving 480 participants, MFVs helped readers identify the underlying distribution more accurately and reduced the tendency to assume normality. In the second experiment, involving 900 participants, the team tested a simplified MFV showing just nine forecasts. Varying the lines’ thickness or opacity to emphasize certain forecasts preserved readers’ ability to perceive the overall distribution.
The findings suggest that showing a carefully selected set of individual forecasts can communicate uncertainty more accurately without overwhelming readers with visual clutter. Weighting forecasts through line thickness or opacity may also let designers highlight additional information while preserving the shape of the distribution. This approach could help people make better-informed judgments about climate predictions and other situations where multiple models produce competing forecasts.
Visual Stenography: Feature Recreation and Preservation in Sketches of Noisy Line Charts (paper)
Hearing through the noise
November 12, 10–11:30 a.m.
Khoury researchers: Michael Correll
Line charts can reveal important patterns in time-series data, including long-term trends, repeating cycles, and sudden peaks or dips. But when charts contain substantial noise, readers may struggle to distinguish meaningful patterns from distracting fluctuations.
In a visual stenography study, participants recreated line charts with varying levels of noise. The team identified three distinct drawing strategies: Replicators, who attempted to preserve all major features, including noise; Trend Keepers, who focused on overall trends while overlooking periodicity and peaks; and De-noisers, who filtered out noise while retaining other patterns. Participants generally reproduced trends and peaks accurately while representing periodicity and noise more loosely (through gestures and general impressions rather than precise details).
The findings reveal how people prioritize different types of information when interpreting complex charts. This research could inform more human-centered approaches to presenting, summarizing, and processing time-series data, helping visualizations emphasize the patterns people find most meaningful.
The Khoury Network: Be in the know
Subscribe now to our monthly newsletter for the latest stories and achievements of our students and faculty